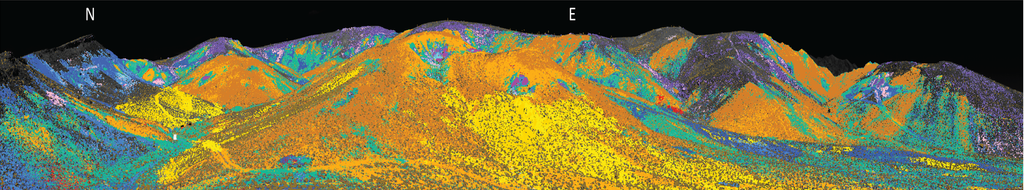
From 700 km up, the Earth looks honest. A satellite glides over a stretch of desert and, in less time than it takes to brew coffee, returns a portrait of the ground built from 224 colors no human eye has ever seen. That portrait is real. It is also, in a very specific way, a beautiful lie.
This is the part nobody tells you about remote sensing.
What satellites actually see
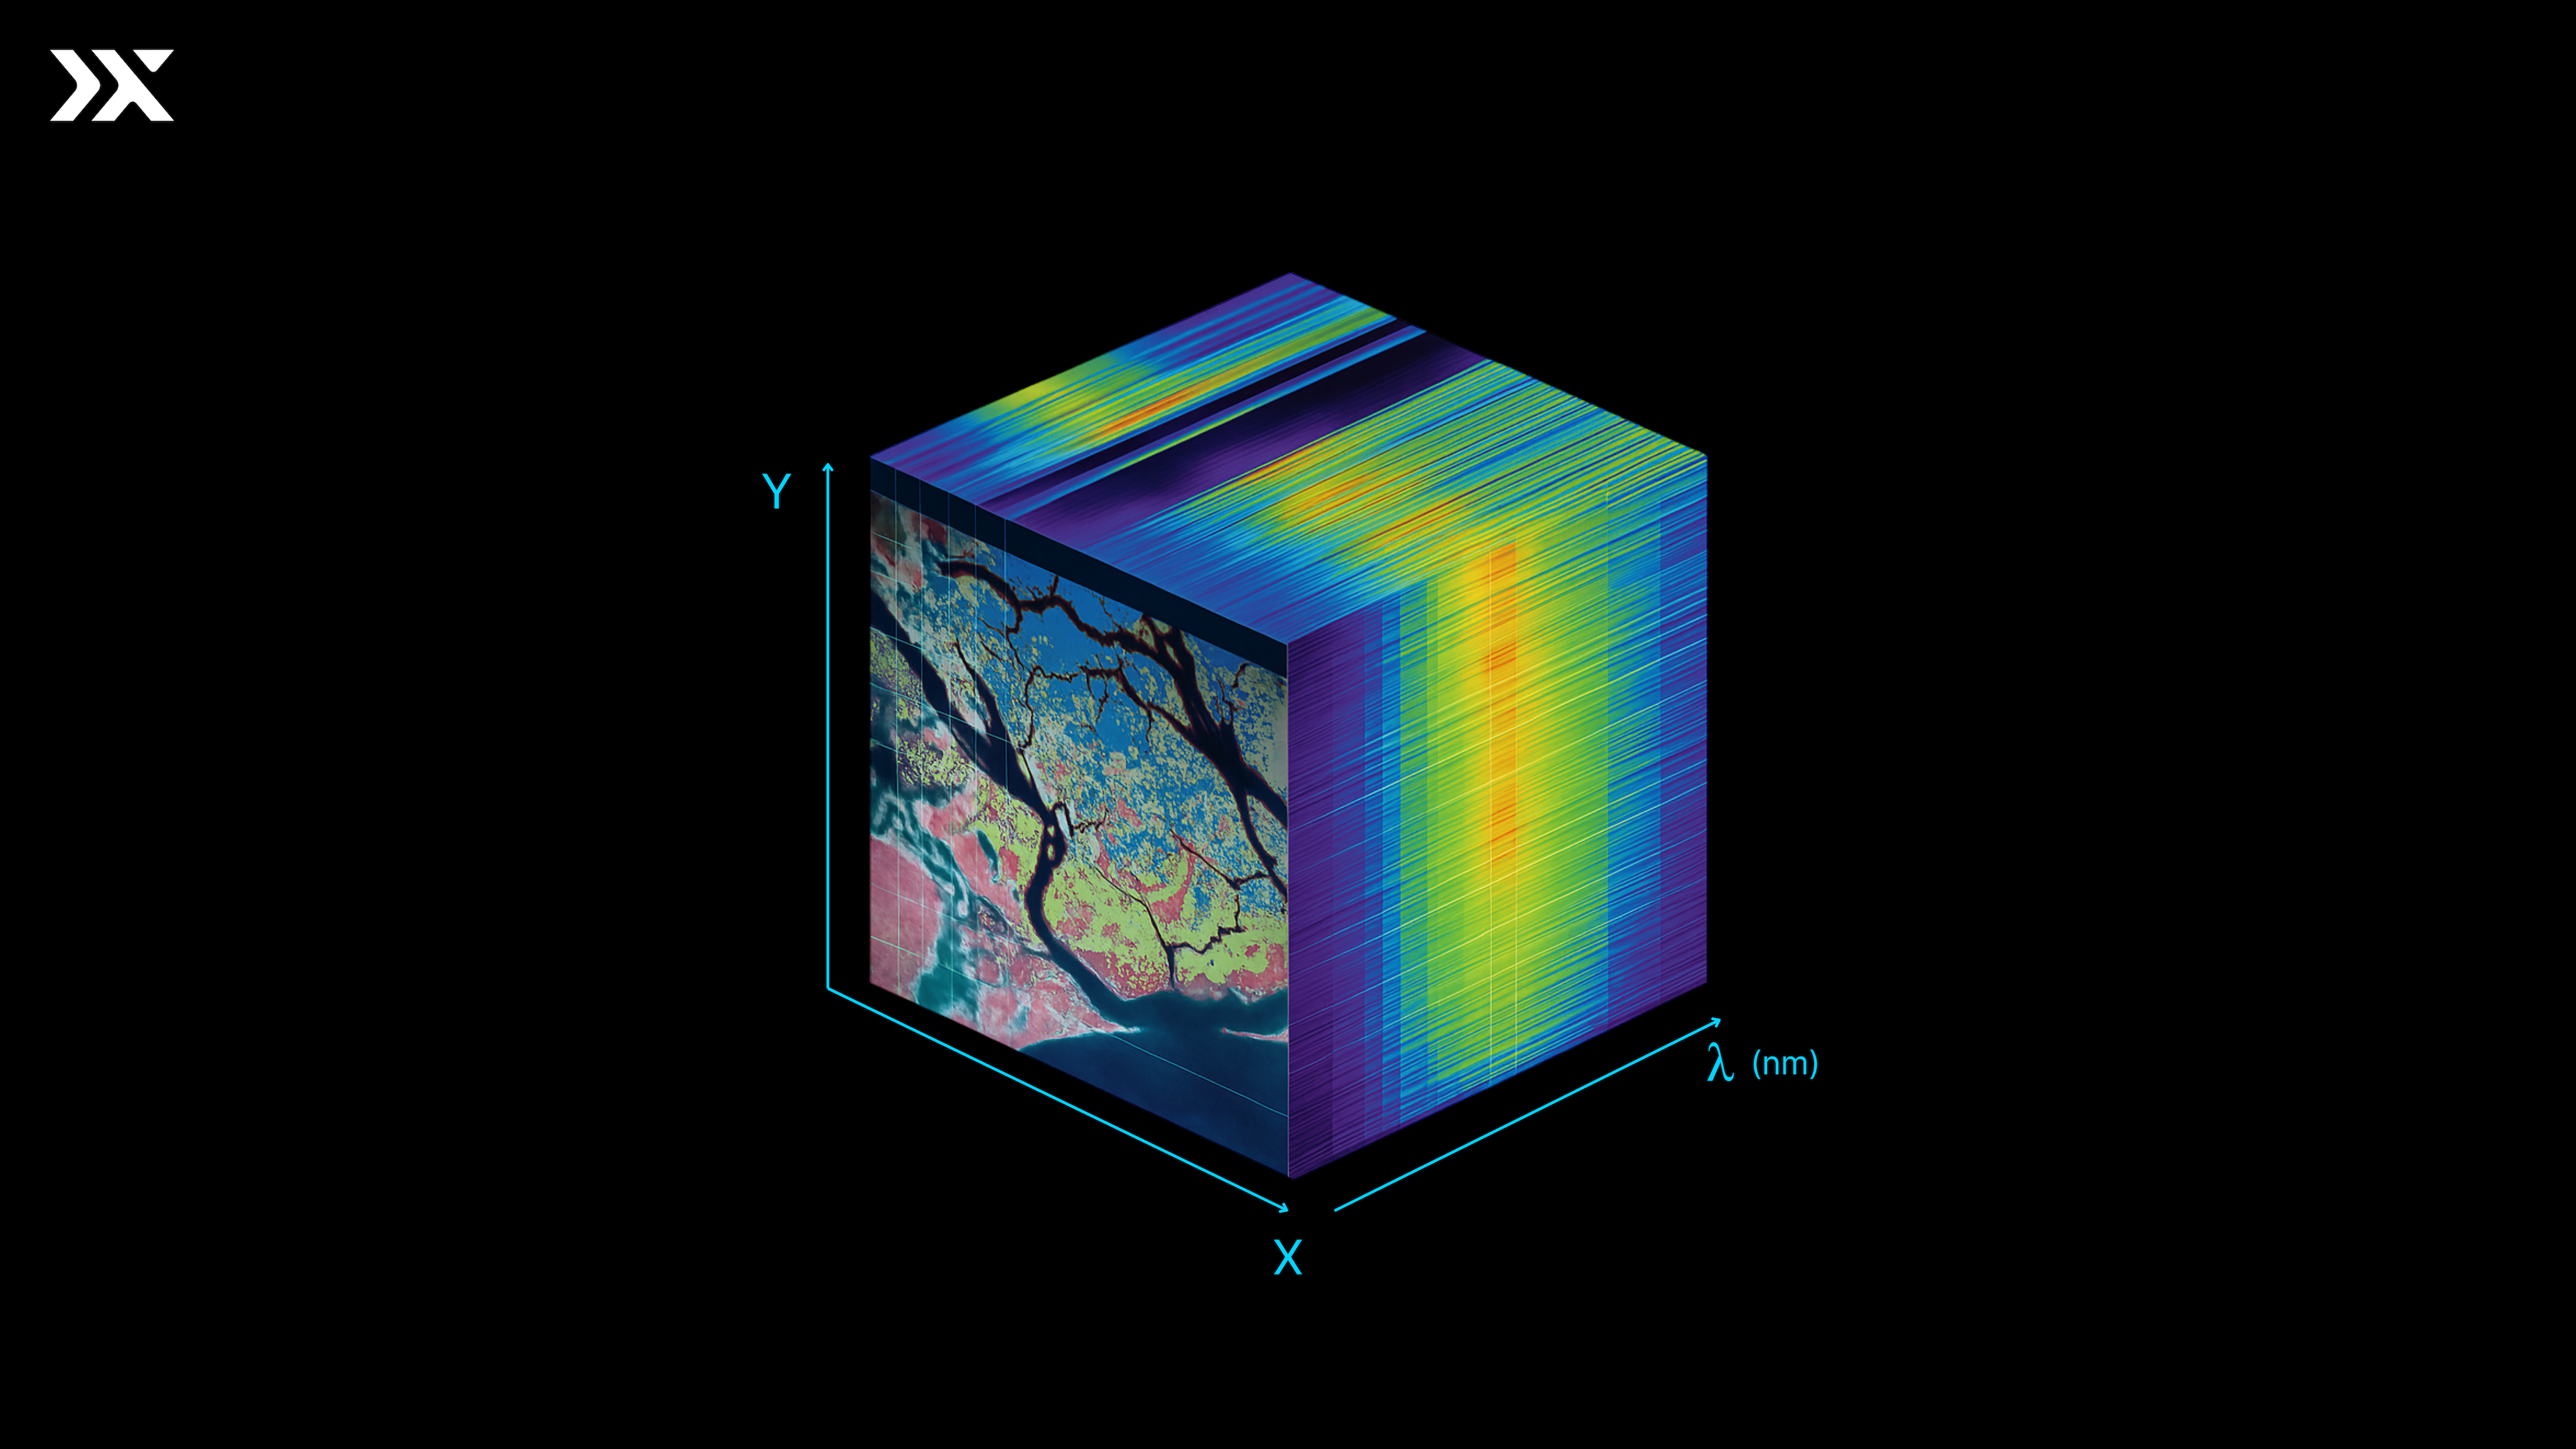
A hyperspectral imager is a prism with ambition. Where your eyes split sunlight into three rough bands (red, green, blue), an instrument like NASA JPL's AVIRIS splits the same beam into 224 narrow slices spanning the visible and shortwave infrared, from roughly 400 to 2500 nanometres. Different minerals absorb different slices. Alunite has a sharp tell at 2.17 microns. Kaolinite leans on a doublet near 2.20. Buddingtonite, the ammonium feldspar that often haunts gold, leaves its signature at 2.12. The satellite reads these dips like a barcode scanner, pixel by pixel, across a kilometre-wide claim block, and hands you back a chemistry map.
It is genuinely magic. It is also a surface phenomenon, in the most uncompromising sense of the word.
Three things the sky cannot tell you
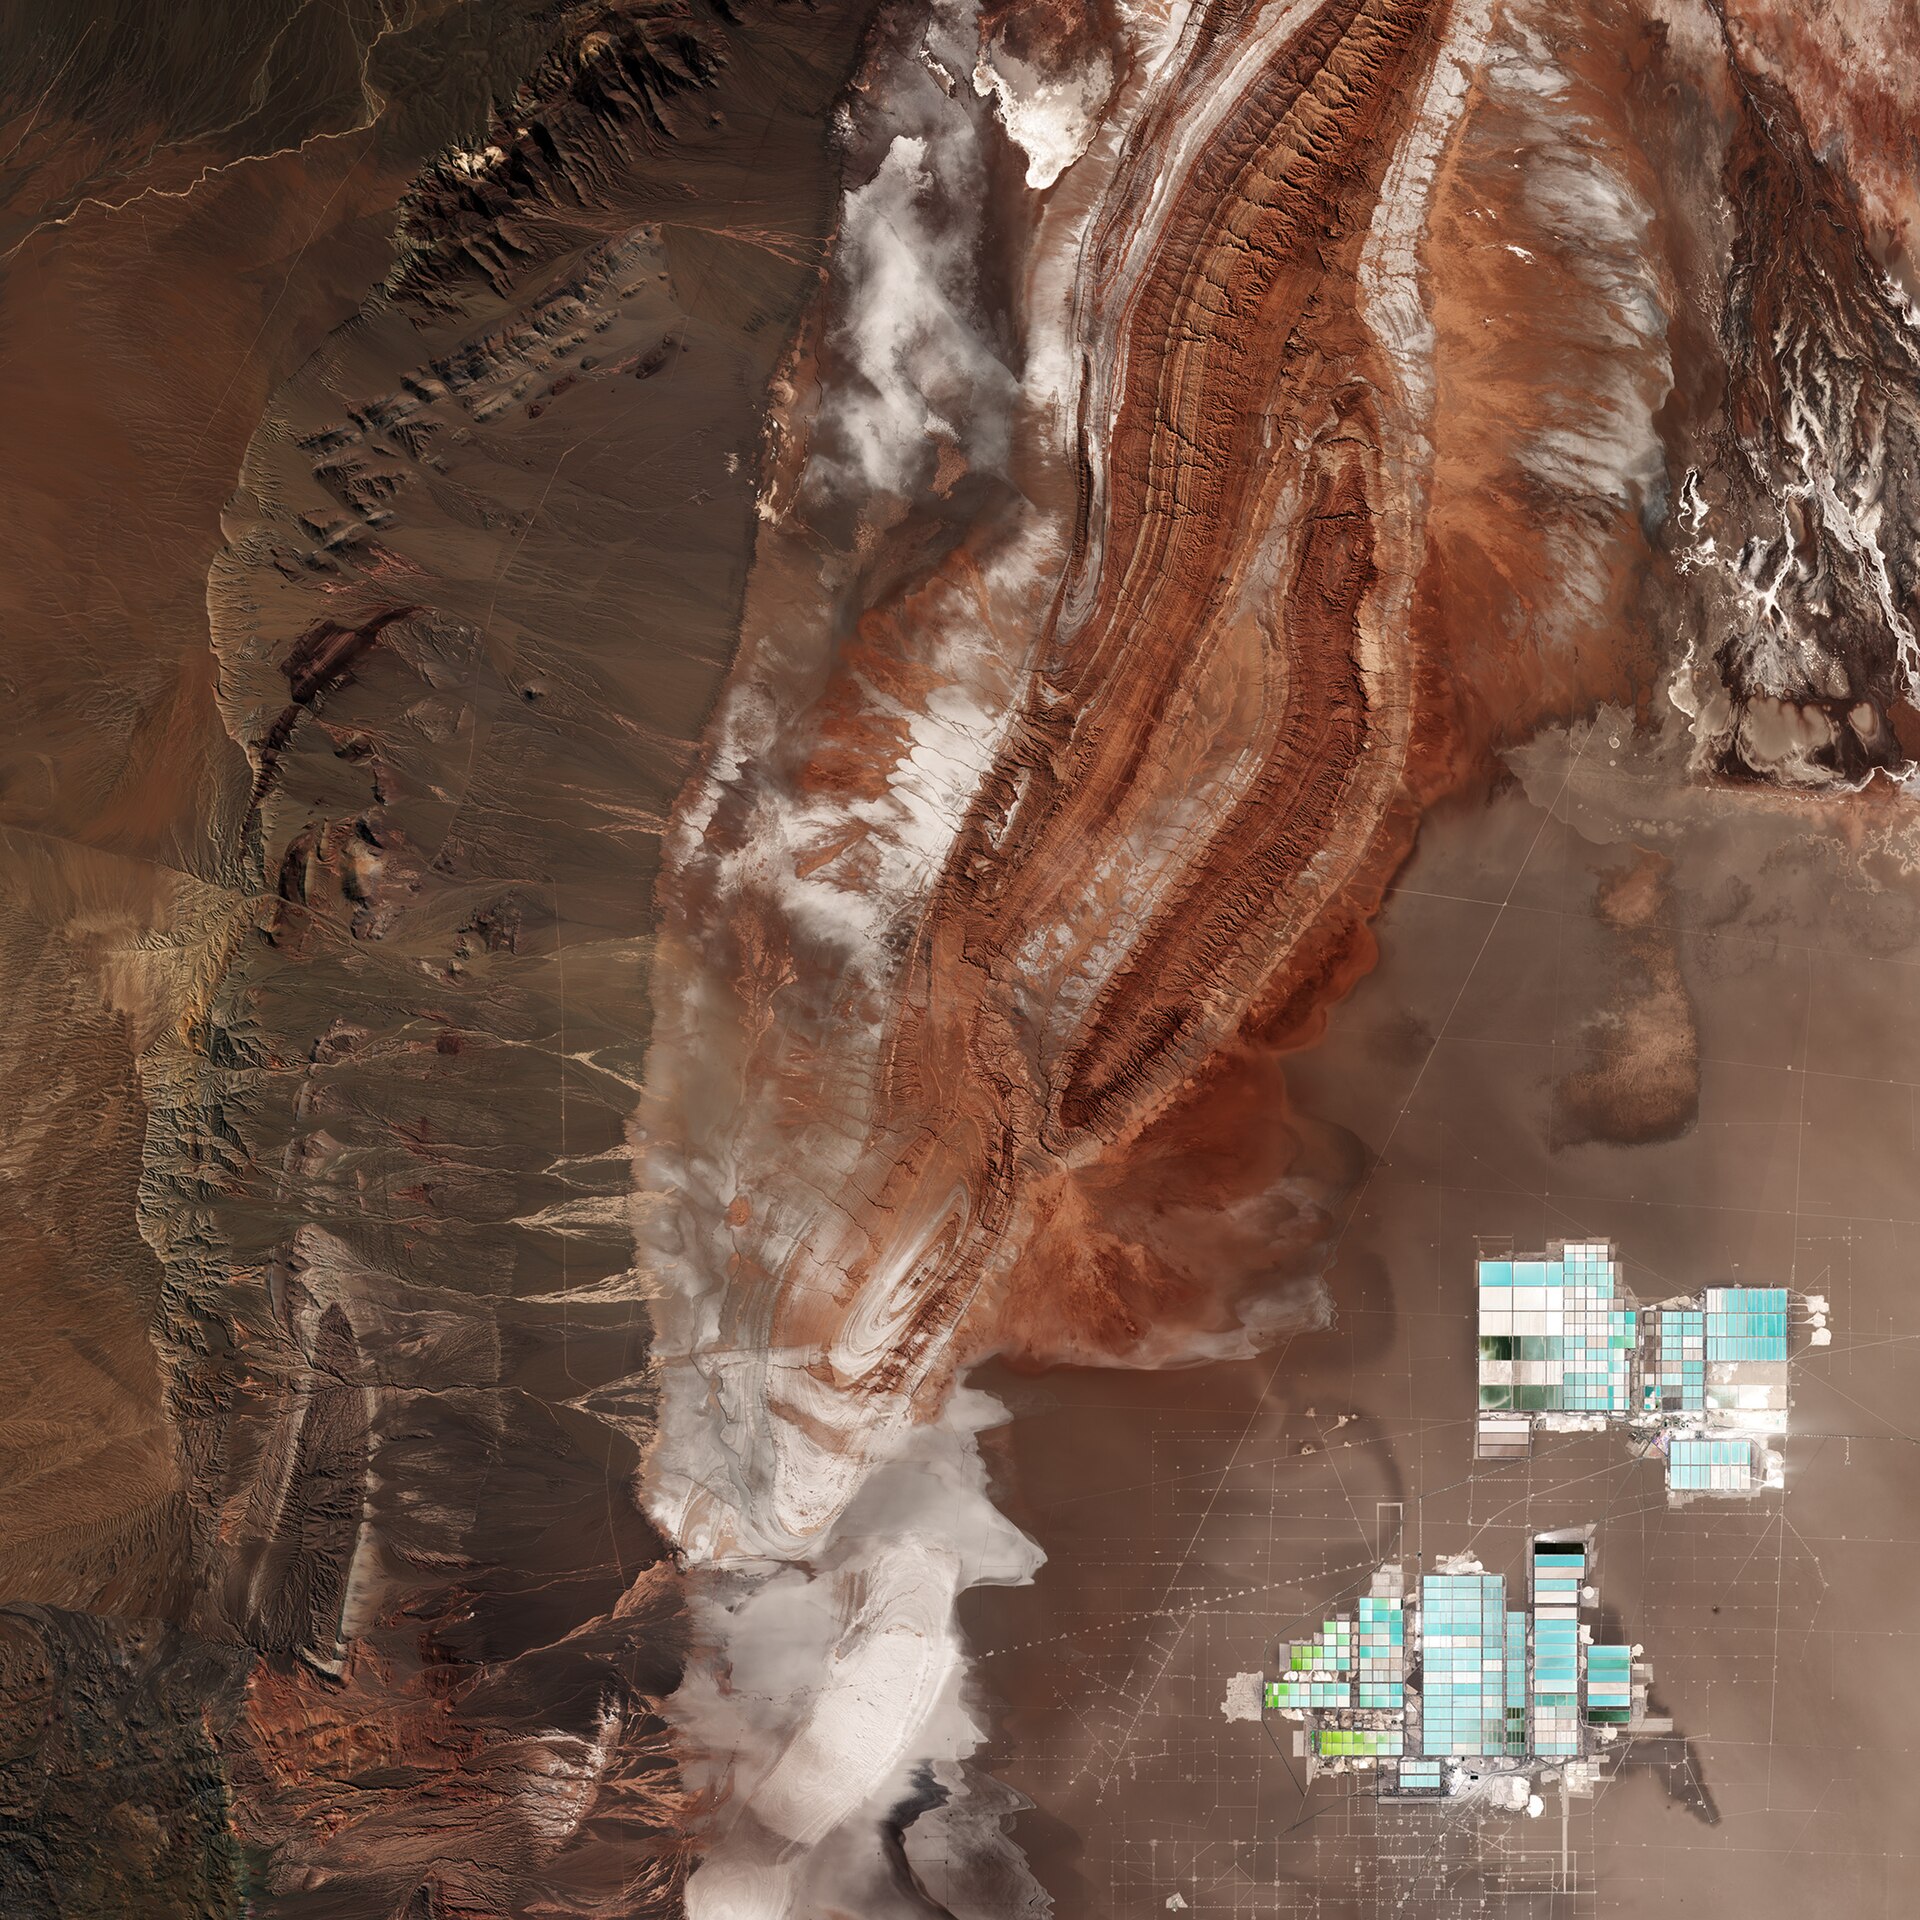
1. The signal stops at the dust on your boots.
Shortwave infrared sees the top few micrometres of the rock, basically nothing. If a pediment of caliche, a meter of alluvial fan, or a forest canopy sits between the satellite and your mineralization, the satellite is doing a very precise study of the cover, not the ore. Roughly two thirds of the continents are obscured in one way or another: vegetation, transported soils, glacial till, lake sediments, ice. A perfect hyperspectral signature of grass tells you nothing about the porphyry sleeping 200 meters below it.
2. Alteration is not ore.
This one hurts. The minerals satellites are best at mapping (alunite, kaolinite, sericite, jarosite, iron oxides) make up the alteration halo around an ore system, not the ore itself. Find the halo and you have found a promising address. You have not found a deposit. The textbook Cuprite, Nevada case, mapped beautifully by USGS researchers using AVIRIS (Swayze et al., 2014), shows almost perfect zoning of advanced argillic alteration. It is a hydrothermal fingerprint you could teach from. It is also famously uneconomic. The plumbing was all there. The metal was not.
3. Every pixel is a committee.
A 17-meter AVIRIS pixel covers about 289 square meters of ground. That single pixel is almost never one mineral. It is a weighted mix of five or six things, projected onto a single spectrum. Spectral unmixing algorithms can pull the components apart, but they introduce ambiguity, and ambiguity at planet scale becomes hallucination. Add the base rate problem (an economic deposit is roughly one anomaly in tens of thousands), and the satellite has just handed you a million plausible places to look. Drilling all of them would cost more than the entire global exploration budget.
What radar, magnetics, and gravity add, and what they don't
The honest geophysicist owns several instruments because each one is truthful about a different thing.
Synthetic aperture radar ignores clouds and night. It sees roughness and structure, the lineaments and scarps that whisper about faulting. It says nothing about chemistry.
Magnetics and gravity reach kilometres deep. They see density and magnetic susceptibility contrasts: a buried intrusion, a sulfide body, a salt diapir, a fault offset. They cannot tell a barren pyrite shell from an ore-grade chalcopyrite shell. The signature looks the same.
Stack all of these together and you get a richer picture. You also get more contradictions: the radar says fault, the magnetics says intrusion, the spectra say argillic, the drilling so far says nothing for sale. Someone has to read the room. Historically that someone was a senior geologist with thirty years in the basin, an internal library of analogues, and a coffee habit. There are not enough of them, and they do not scale.
How a context-aware AI agent closes the loop
Here is what changes when an agent reads the picture instead of a human pulling six layers into ArcMap by hand.
A context-aware agent does not look at a pixel in isolation. It holds the whole project in working memory at once: the regional tectonic setting, every legacy drill log on the property, the historical surface geochem, the structural interpretation from last quarter's magnetic inversion, the analogue deposit two basins over that produced a million ounces of gold, and the satellite cube that landed this morning. When it sees an alunite anomaly on a ridge, it does not just flag it. It asks, in writing, whether the regional architecture supports a high-sulfidation system here, whether the depth to basement is right, whether the closest historic hole tickled anything interesting, and whether the alteration zoning resembles the analogue or only the textbook.
It writes you a paragraph. The paragraph is wrong sometimes. But you can read it, argue with it, and audit it. That is a vastly more useful artifact than a confidence raster.
The agent also remembers. Every drill result you feed back into the system reshapes the next survey: which spectra correlated with grade, which targets fizzled, which ones the model never would have ranked on its own. The satellite cannot learn from drilling. The agent can.
A new division of labor
None of this means the satellite was wrong. The satellite was always doing the right thing, just at one specific layer of the problem. The shift is that we no longer ask the satellite to be the geologist. The satellite gathers. The agent interprets. The human decides where the rig moves on Monday.
That is the right division of labor for a planet that is running out of easy copper, and running out of patience to find the hard kind.
References & further reading
- Swayze, G.A., Clark, R.N., Goetz, A.F.H., Livo, K.E., Breit, G.N., Kruse, F.A., Sutley, S.J., Snee, L.W., Lowers, H.A., Post, J.L., Stoffregen, R.E., Ashley, R.P. (2014). Mapping Advanced Argillic Alteration at Cuprite, Nevada, Using Imaging Spectroscopy. Economic Geology, v.109, no.5, pp.1179–1221.
- Kokaly, R.F., Clark, R.N., Swayze, G.A., et al. (2017). USGS Spectral Library Version 7. U.S. Geological Survey Data Series 1035.
DOI: 10.5066/F7RR1WDJ - NASA Jet Propulsion Laboratory. AVIRIS, the Airborne Visible / Infrared Imaging Spectrometer. aviris.jpl.nasa.gov
- Sabins, F.F. (1999). Remote sensing for mineral exploration. Ore Geology Reviews, v.14, no.3–4, pp.157–183.
- van der Meer, F.D., van der Werff, H.M.A., van Ruitenbeek, F.J.A. (2014). Potential of ESA's Sentinel-2 for geological applications. Remote Sensing of Environment, v.148, pp.124–133.
- Calvin, W.M., Pace, E.L. (2016). Mapping alteration in geothermal drill core using a field portable spectroradiometer. Geothermics, v.61, pp.12–23.
- Cracknell, M.J., Reading, A.M. (2014). Geological mapping using remote sensing data: A comparison of five machine learning algorithms. Computers & Geosciences, v.63, pp.22–33.
- Society of Economic Geologists. Special Publication 18: Building Exploration Capability for the 21st Century. SEG, 2014.